Graph 1
| 
| 
|
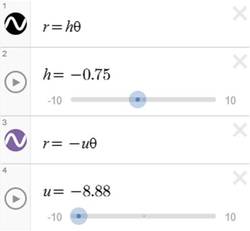
Using gifsmos.com I was able to create the animated picture above. The equations that we have learned throughout the trimester helped me create this gif (shown above). Once I got more comfortable with the equations I was able to mess around with them to create new pictures and graphs. By putting a coefficient in front of the equation I was able to make a slider; once that slider was made the picture could move from one quadrant to the next or get bigger and smaller.
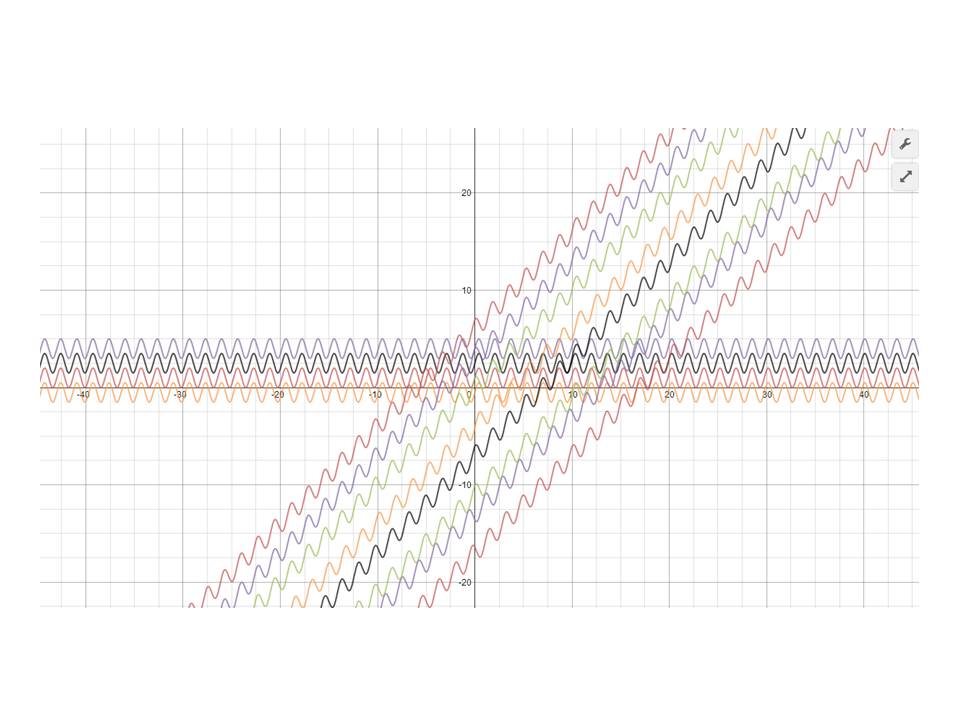
Graph 2
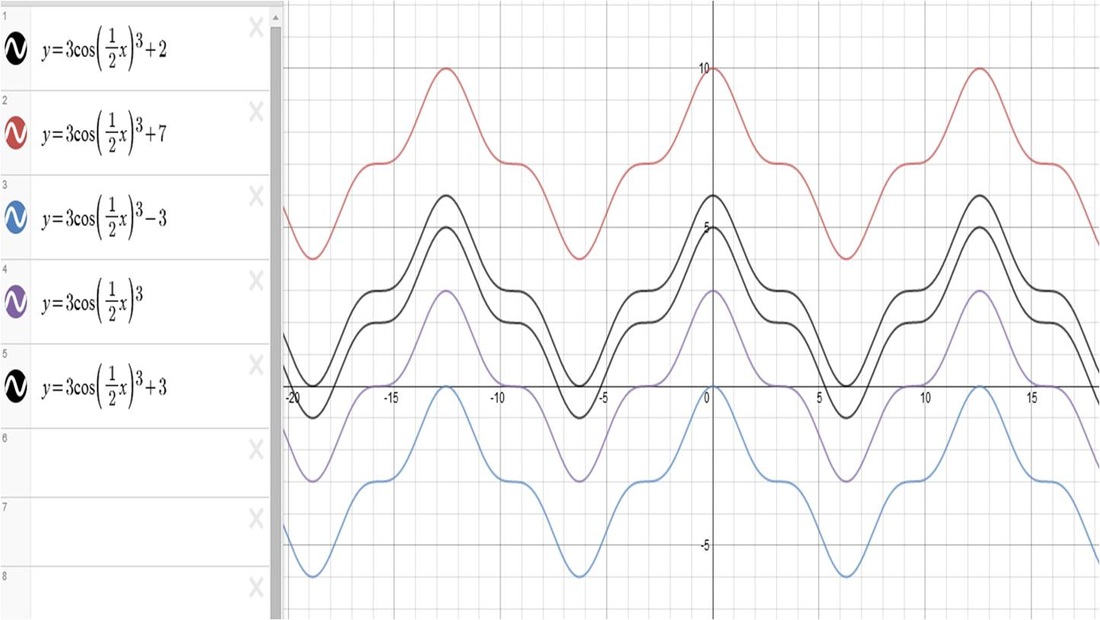
The equation y=acos(n*x)+b was the equation I used to make this mountain-like graph you see above. By raising the equation to a certain power I was able to create the maximums and minimums shown in the graph. When the "b" was changed, the graph was forced to move below or above the x-axis. The equation could have been as simple as y=cosx but by adding an "a", "b", and "n" the graph got much more complex.
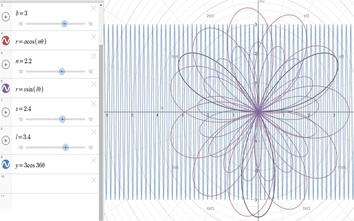
Graph 3
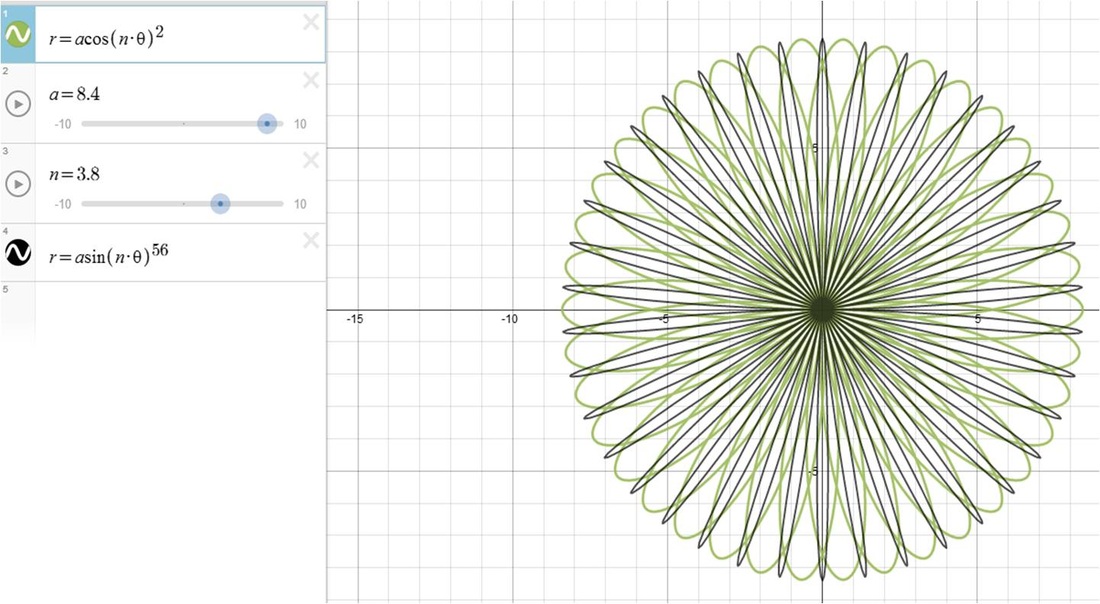
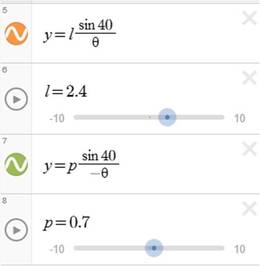
To make this fabulous flower I used the equation r=acos(n*theta) and r=asin(n*theta). The way I made it more complex was adding an exponent to it. The higher the exponent was, the more petals the flower obtains. Without the exponents in the equation the petals would never get as thin as they are in the picture above.
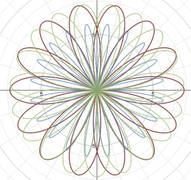
Reflect
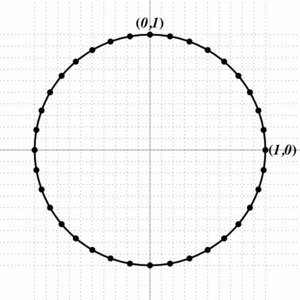
| The picture to the left is my very first desmos "art". I put quotations because that's not much of an art piece. It's more like a graph created by a student that was confused and needed some kind of graph to blog about. This graph is much different from my other three because I had no idea what I was doing. My more advanced graphs show that I was able to understand the equations I was using. I now know what part of the equation makes the art bigger or smaller. Learning all the equations I did in Pre Calc helped me understand why the numbers or letters in the equation do what they do. |
 RSS Feed